


Greenhouse effect gases
In 2024, total emissions of greenhouse gases in Hungary were 53.7 million tonnes carbon dioxide equivalents (CO2-eq) excluding the LULUCF sector. Taking into account also the mostly carbon absorbing processes in the LULUCF sector, the net emissions of Hungary were 47.3 million tonnes CO2-eq in 2024. Being about 5.5 tonnes, the Hungarian per capita emissions are below the European average.
At the beginning of the time series, the marked decline is largely a consequence of the political and economic transition: by 1992, emissions had already decreased by around 30% due to the contraction of energy, industrial, and agricultural production. This was followed by a 14-year period (1992–2005) during which the country’s greenhouse gas emissions remained relatively stable, before declining significantly again by 24% between 2005 and 2013. The global economic crisis of 2008–2009 had a substantial impact on the performance of the Hungarian economy and fundamentally shaped the trend of domestic greenhouse gas emissions. Emissions decreased by 9% between 2008 and 2009, and after a temporary, slight increase, they continued to decline year by year after 2010. In contrast, economic performance began to recover from the second quarter of 2010, with GDP reaching pre-crisis levels by 2014 and exceeding them in 2015. After 2013, emissions started to rise again—showing an overall increase of 11% by 2017. Since then, apart from the emission reduction caused by the COVID-19 pandemic in 2020, no clear trend has been observed. By 2021, emission levels had returned to values similar to those seen before the pandemic. The decline in greenhouse gas emissions starting from 2022 was primarily the result of reduced industrial production and the shutdown of energy-intensive sectors, driven by the economic and energy crisis.
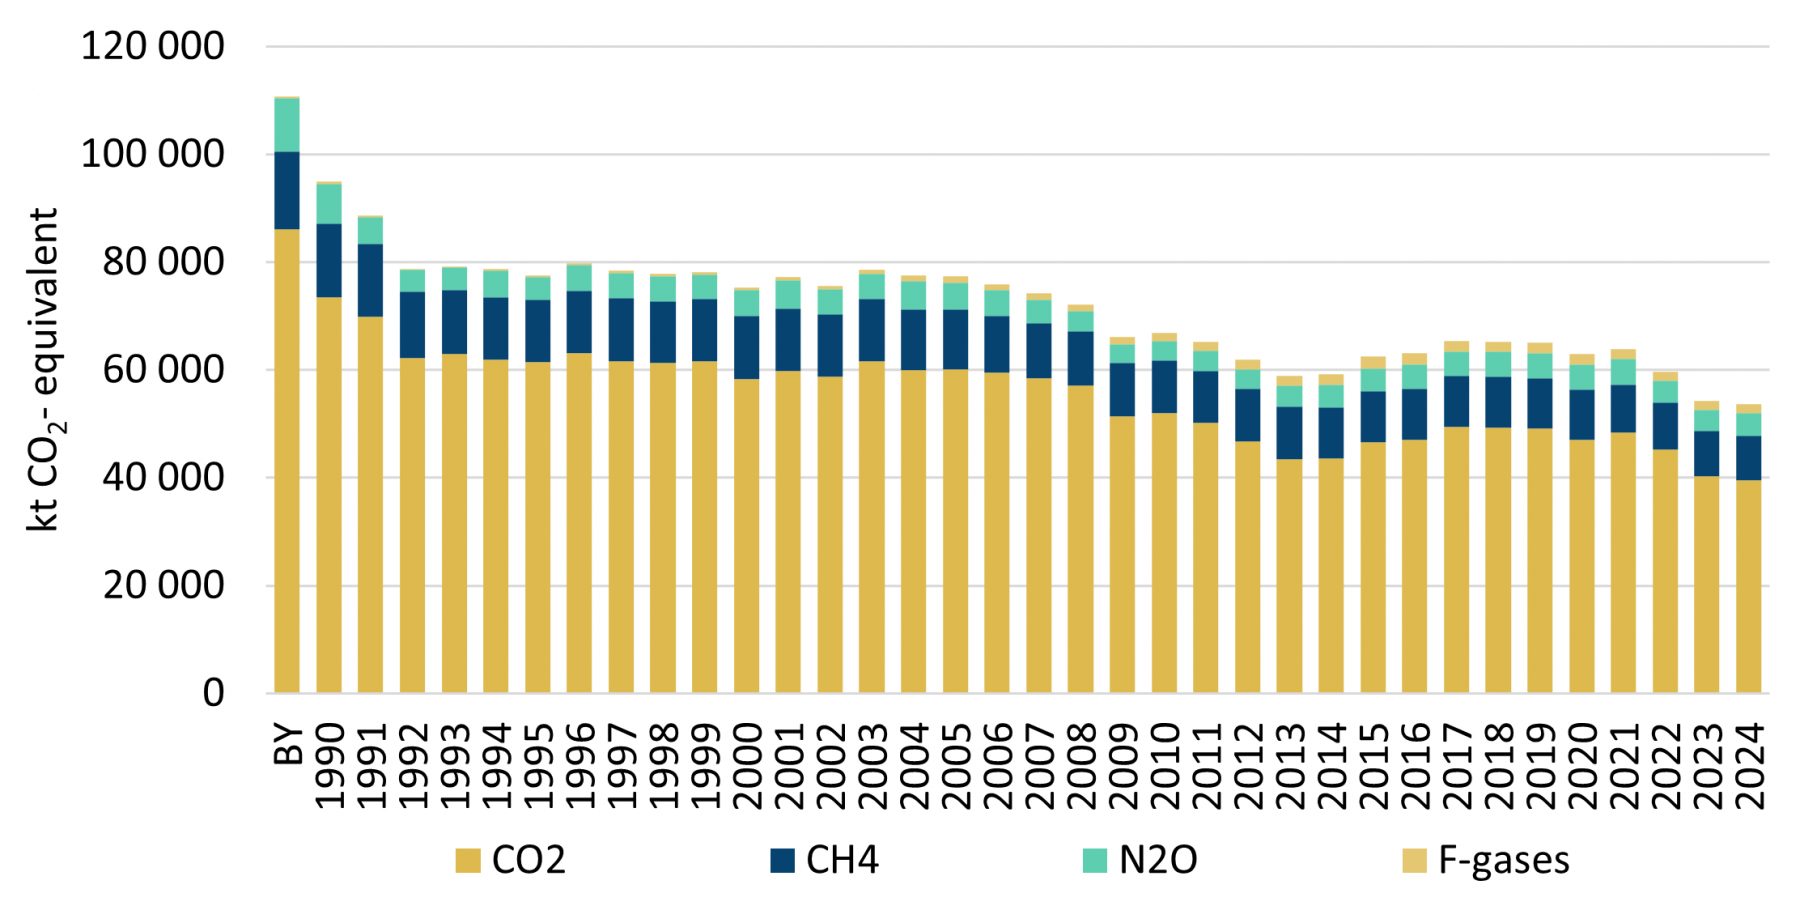
Figure 1. GHG emission trends between base year and 2024, by gas
The most important anthropogenic greenhouse gas is carbon dioxide (CO2), which accounted for 74% of total emissions in 2024. Over the entire time series, this share has ranged between 74% and 80%, clearly highlighting its dominant role. About 91% of CO2 emissions originate from the energy sector through the combustion of fossil fuels, and its emissions have decreased by 54% since the mid-1980s.
Methane (CH4) represents 16% of total greenhouse gas emissions. It is primarily generated from livestock farming and waste management, but a certain amount also leaks during the transport of natural gas. Compared to 1985–1987, methane emissions have decreased by 42%, with a slight decline observed over the past five years.
Nitrous oxide (N2O), accounting for 8% of total emissions, is mainly released from agricultural soils and pastures, as well as from chemical industry processes. Its emissions have fallen to less than half of the base-year level (−58%).
F-gases make up 3% of total greenhouse gas emissions. Due to the sharp increase observed in the early 2000s, their use still requires attention—for example, the application of ozone-friendly HFCs in refrigeration and air conditioning equipment, as well as the use of SF₆ gas as an insulating and arc-quenching medium in electrical switchgear.
 Figure 2. Main sectors contributing to greenhouse gas emissions in 2024
For more information on sectoral emissions go to Sectoral emissions.